Blog
June 3, 2015
How affordable is healthcare where you live? Our new U.S. Healthcare Affordability Index will show you
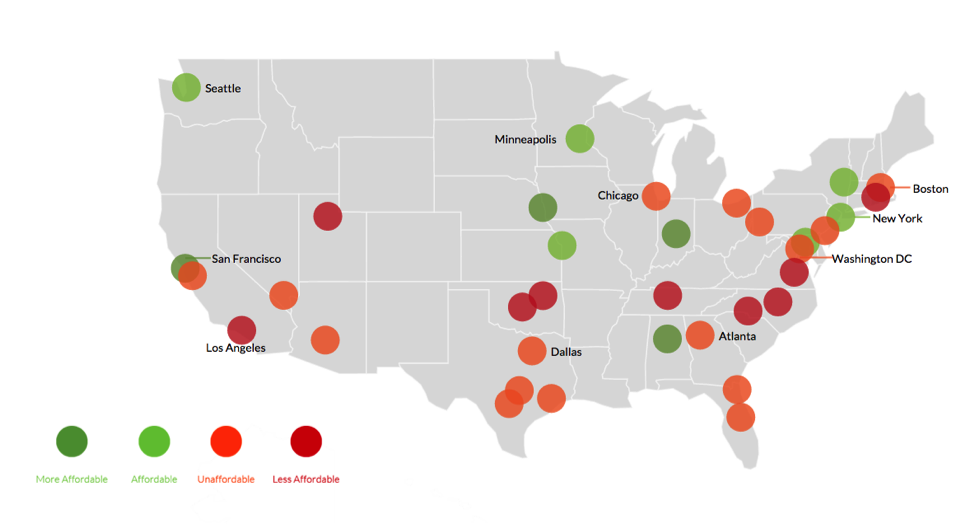
When it comes to healthcare costs for employers and their employees, location matters. That’s the key takeaway from Castlight’s U.S. Healthcare Affordability Index, which examines the correlation between annual wage and healthcare cost changes year-over-year from 2013 to 2014 in 35 U.S. cities and metro regions. This year’s Index shows rising healthcare costs across the U.S., with an average increase of 10% in the 10 cities with the least affordable healthcare.
Published as an interactive map, the index clearly shows that the affordability of healthcare is not an isolated, regional, rural, or urban phenomenon. Rather, it is a national crisis. The index presents a normalized view between the year-over-year increase in annual wages, as reported by the Bureau of Labor Statistics, versus the change in healthcare costs in each city, using Castlight customer reporting data aggregated at the Metropolitan Statistical Area (MSA) level.
The cities with the least affordable healthcare are:
- Charlotte, NC
- Tulsa, OK
- Richmond, VA
- Providence, RI
- Raleigh, NC
- Oklahoma City, OK
- Nashville, TN
- Los Angeles, CA
- Salt Lake City, UT
- Phoenix, AZ
The cities with the most affordable healthcare are:
- Omaha, NE
- Birmingham, AL
- San Francisco, CA
- Indianapolis, IN
- Seattle, WA
- Baltimore, MD
- Kansas City, MO
- Albany, NY
- New York, NY
- Minneapolis, MN
There are a variety of factors that influence affordability, creating four basic trend scenarios. Let’s take a look at a few of the many potential drivers for each trend scenario!
Scenario #1: Employer and employee healthcare costs went up
- Providers raised prices
- New healthcare services became available in the area (e.g., 3-D ultrasound)
Scenario #2: Employer and employee costs went down
- Employees received less care because younger, healthier people were hired by employers
- More care happened outside of the medical claims process (e.g., on-site clinics and retail clinics)
Scenario #3: Employer costs went up while employee costs went down
- Fewer employees on high-deductible plans meant employers pay more
- More employees stayed in-network so employers covered a greater share of cost
Scenario #4: Employer costs went down while employee costs went up
- Employees received less preventive care (covered at 100%) rather than need-based care
- Employers shifted a greater portion of cost to employees via high-deductible plans
The Castlight U.S. Healthcare Affordability Index vividly illustrates the seriousness of America’s healthcare crisis. Interested in learning more about the high cost of healthcare? No problem!
Here are a few of our other interactive insights to explore:
- U.S. Cities Analysis: Illustrates the wild variation in price for four common medical services across and within major U.S. cities
- Distinctive Searchers Analysis: Examines employees’ health search patterns in Castlight’s Enterprise Healthcare Cloud over a one-year period


