
Vulnerable communities: Populations at risk of severe disease from COVID-19 facing potential intensive care shortages
As the coronavirus pandemic sweeps across the United States, it is increasingly critical to channel prevention and response efforts to the areas of highest need. Some communities in the U.S. are starting to face shortages of available resources needed to care for patients with COVID-19 such as Intensive Care Unit (ICU) beds and ventilators. Public health authorities and provider systems require a clear understanding of those areas that are likely to have large populations of people at risk for severe illness due to coronavirus and have limited intensive care capacity to focus their prevention efforts and direct their surge capacity resources.
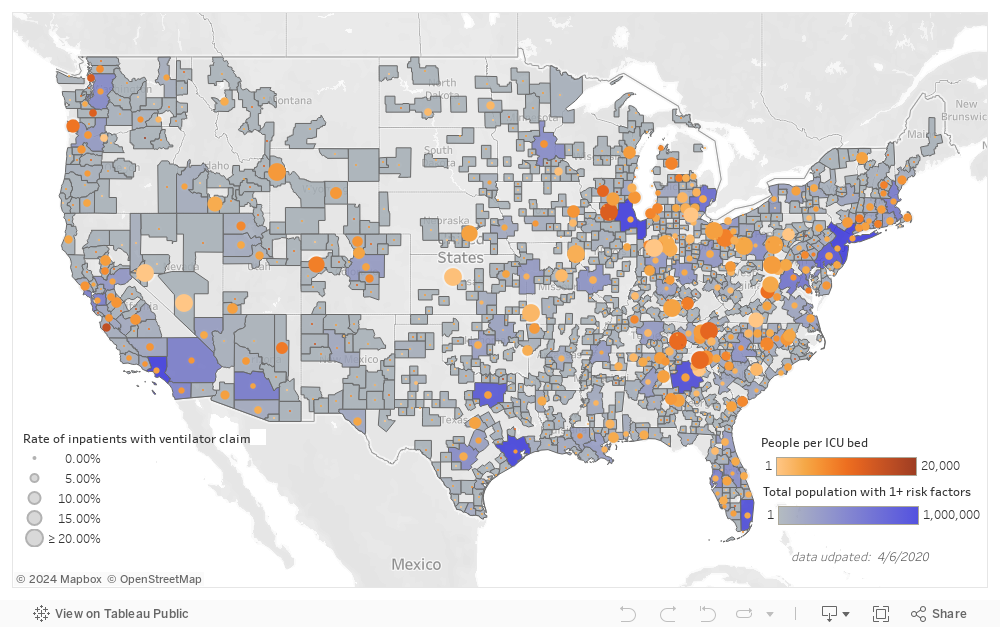
To help predict where the U.S. may need to prioritize resources, Castlight mapped the geographic distribution of populations at greatest risk of severe infection from COVID-19 living in areas where they are likely to face limited capacity for intensive care. The interactive map below provides information about which metro areas are most likely to be overwhelmed by the COVID-19 pandemic.
Key Findings
- Results from more than 6 million people with commercial coverage indicate that 22.8% would be at risk of serious illness if infected with COVID-19 due to underlying chronic conditions such as diabetes, asthma, and heart disease. 28.4% of those individuals (6.4% of our eligible population) would likely have challenges accessing critical care.
- In addition to New York and Seattle which have been prominently featured in the news, high-risk individuals are most likely to face lack of access to critical care resources (such as ICU beds and ventilators) in the metro areas surrounding Atlanta, Detroit, Dallas, Charlotte, Chicago, Houston, San Diego, and Cincinnati.
- Within counties, there is considerable variability in local high-risk populations–underscoring the need for local officials to coordinate care of the population in their region.
- Among the communities with high-risk populations for severe disease with COVID-19, New Orleans and Memphis are notable for having low household median income (less than $50,000 for both cities), which may make them particularly vulnerable.
- A prior or current history of a diagnosed pulmonary condition was the most prevalent risk factor, assessed in 13.5% of the population, followed by high blood pressure (5.3%), heart disease (4.5%), diabetes (2.5%), cancer (1.7%) chronic kidney disease (0.3%) and immunosuppression (0.1%).
- Increasing risk of severe disease is associated with increasing age, with 21% at risk among children 0 to 17 years old compared with 39% among people aged 60 years or older.
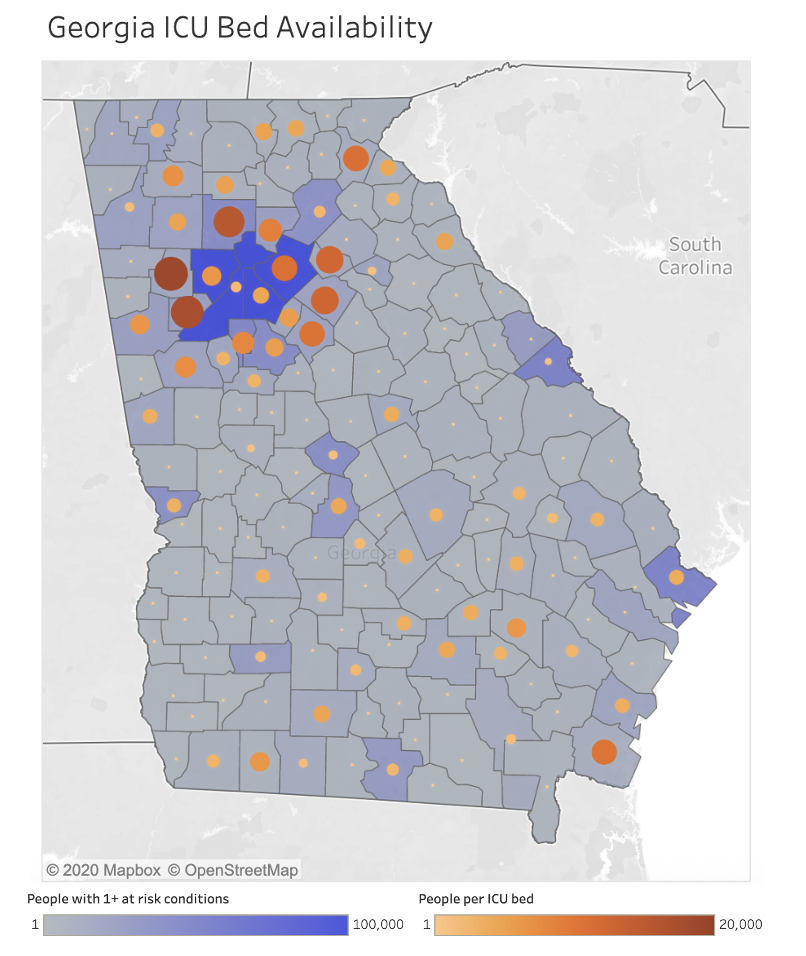
To help with local preparedness efforts, Castlight is making this interactive map available. Many insights are clearest when viewed at the state or local level. For example, the map of Georgia, below, shows that metropolitan areas often have hotspots of need with variability of critical care capacity and that rural areas have very few ICU beds–a finding that is common across the US.
At the most local level, this map of San Mateo and Santa Clara counties in northern California clearly demonstrates that high-risk populations often neighbor much lower risk populations. As local public health and hospital officials plan their COVID-19 responses, coordination will be essential to prevent some hospitals from becoming overwhelmed.
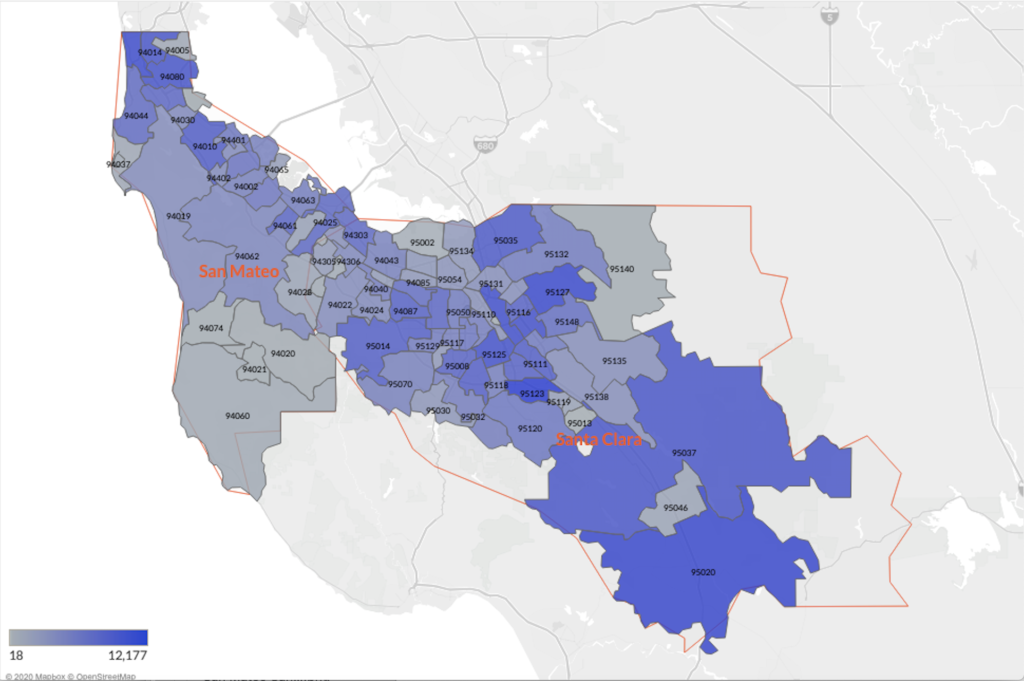
Legend: This map represents the number of people in each zip code with one or more conditions that put them at higher risk for severe COVID-19 illness. This map was made by applying the proportion of people with risk factors in the Castlight database to the total population in each zip code.
Methods
From more than 6 million people with commercial health insurance, Castlight identified those who would be at risk for the most serious outcomes associated with COVID-19. We assessed this risk by evaluating medical claims indicating a prior or current clinical history that matched published risk factors, including pulmonary disease, hypertension, heart disease, cancer, chronic kidney disease, or use of immunosuppressive medications. We then mapped the geographic distributions of population with one or more risk factors across the U.S. by Core-Based Statistical Areas (CBSAs).
To determine the areas where healthcare resources would be a barrier to getting care for this at-risk population, we overlaid ICU bed capacity in each CBSA and limited the data to counties where there was a population greater than 7,037 people per ICU bed (75th percentile of ICU bed by county data) or counties with no ICU beds. We then examined the baseline (pre-COVID-19) rate of ventilator use in each area to assess utilization of critical care resources for non-COVID patients.
We continually update our tables and graphs as new data becomes available. A subsequent study was conducted refining the inclusion criteria for chronic conditions based on emerging CDC guidelines and published reports. We have updated our tables, graphs, and some findings to reflect this analysis.
Conclusion
Predicting the communities of highest need as the pandemic continues to escalate can help not only prioritize prevention efforts and COVID-19 response resource allocation, but can also help public health officials, employers, health plans, physicians, and other healthcare leaders effectively communicate with at-risk populations and help them prepare. Castlight’s mission is to ensure that people get the care they need in a timely manner. Castlight has provided heat maps to enterprise customers leveraging their own claims data to help identify hot spots in their employee communities. This analysis enables customers to prepare mitigation strategies for these vulnerable populations, including extra vigilance around COVID symptoms and communication approaches to engage these populations with specific guidance.
Top 10 At-Risk Cities
The table below represents the cities with the highest percentage of individuals at-risk for serious COVID-19 cases and a scarcity of ICU beds or ventilators of the most populous metro areas in the U.S.
| Search | |||
|---|---|---|---|
| Metro Area | Total Population | Fraction of population with 1 or more risk factors | Individuals per ICU Bed |
| Baton Rouge, LA | 851,622 | 18.07% | 6,867 |
| Atlanta-Sandy Springs-Alpharetta, GA | 5,700,990 | 15.61% | 4,758 |
| Jacksonville, FL | 1,447,884 | 15.20% | 2,973 |
| San Antonio-New Braunfels, TX | 2,377,507 | 15.12% | 3,501 |
| Rochester, NY | 1,080,653 | 14.89% | 4,781 |
| Detroit-Warren-Dearborn, MI | 4,304,613 | 14.78% | 3,717 |
| Miami-Fort Lauderdale-Pompano Beach, FL | 6,019,790 | 14.67% | 3,807 |
| Oklahoma City, OK | 1,353,504 | 14.15% | 3,435 |
| Cleveland-Elyria, OH | 2,062,764 | 13.75% | 2,559 |
| Columbus, OH | 2,023,695 | 13.66% | 3,692 |
Top 10 Overall Areas
The table below represents the metro areas, regardless of population size, with the highest percentage of individuals at-risk for serious COVID-19 cases and also with ICU bed scarcity.
| Search | |||
|---|---|---|---|
| Metro Area | Total Population | Fraction of population with 1 or more risk factors | Individuals per ICU Bed |
| Bonham, TX | 33,787 | 25.97% | 16,893 |
| Bay City, TX | 36,744 | 25.97% | 6,124 |
| Talladega-Sylacauga, AL | 80,888 | 24.77% | 5,777 |
| Gainesville, TX | 39,064 | 24.62% | 7,812 |
| Blytheville, AR | 43,534 | 23.92% | 8,706 |
| Laurel, MS | 84,875 | 23.78% | 6,062 |
| Alice, TX | 52,752 | 23.49% | 6,594 |
| DeRidder, LA | 36,598 | 23.36% | 6,099 |
| Palatka, FL | 72,435 | 23.14% | 7,243 |
| Jackson, OH | 32,624 | 23.11% | 8,156 |

